
Page 23 - Mapping the Nation: Taking Climate Action
P. 23
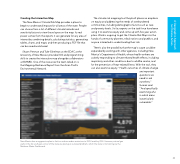
Creating the Interactive Map The New Mexico Climate Risk Map provides a place to begin to understand impacts for all areas of the state. People can choose from a list of different climate hazards and sensitivity factors to view those layers on the map. Its real power comes from the reports it can generate for any area of interest by combining details; calculating statistics; generating tables, charts, and maps; and then producing a PDF file that can be saved and shared. Shawn Penman and Tyler Eshelman at the EDAC at the University of New Mexico provided GIS and programming skills to create the interactive map alongside collaborators at EMNRD. One of the resources the team relied on is the Mapping Resilience Report from the Asian Pacific Environmental Network. The climate risk mapping tool they built places an emphasis on equity and addressing the needs of overburdened communities, including demographic factors such as race and poverty levels. So far, experts on the task force have been using it to examine equity and come up with five-year action plans. Work is ongoing to get the Climate Risk Map into the hands of community planners, tribal nations and pueblos, and anyone interested in understanding their risk. There's also the possibility that the map's scope could be expanded by working with other agencies, including New Mexico's Department of Health, whose health workers are actively responding to climate-related health effects, including respiratory and other conditions due to wildfire smoke, and for the prevention of heat-related illness. With the tool, they can also examine equity. "Health outcomes of climate change are important questions we need to ask ourselves," Gomez said. "And specifically examining who in which areas is particularly vulnerable." New Mexico has an aggressive plan to limit or reduce carbon emissions to 2005 levels by 2050. However, natural gas wells in the far southeast corner of the state are posing an outsized problem, which the state is monitoring via the Methane Waste Dashboard. 22 to Climate Action A Geographic Approach
