
Page 11 - GIS for Science: GIS Response to COVID-19
P. 11
A single epidemiological model is not enough to model the complex phenomena of COVID-19: where one model suffers, another may excel. On the surface, the CHIME Model and COVID-19Surge appear to do the same thing — estimate hospitalizations — using similar types of epidemiological models. However, the critical figures that drive these tools are very different. The results of the CHIME Model tool are driven predominantly by the number of hospitalized COVID-19 patients and the amount of time it takes the disease to double in the population. The COVID-19Surge tool is instead driven by the number of cases and the number of new infections that have been observed per case. These differences may seem subtle, but the different inputs for each model, along with the slight differences in the type of compartmental epidemiological models used, can lead to big differences in the results of each tool. The data for one tool may be also easier to obtain—or less reliant on external factors such as testing—than the other. Therefore, it is important not to consider a single model in isolation. Models are only a simulation, and these simulations depend on the modeling techniques and data inputs. The more models we consider, the more certain we can be of our results.
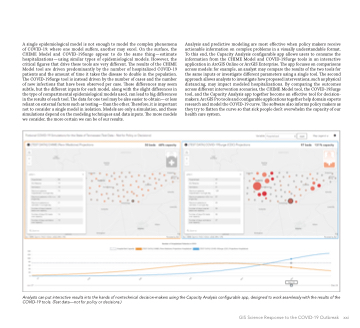
Analysis and predictive modeling are most effective when policy makers receive actionable information on complex problems in a visually understandable format. To this end, the Capacity Analysis configurable app allows users to consume the information from the CHIME Model and COVID-19Surge tools in an interactive application in ArcGIS Online or ArcGIS Enterprise. The app focuses on comparisons across models: for example, an analyst may compare the results of the two tools for the same inputs or investigate different parameters using a single tool. The second approach allows analysts to investigate how proposed interventions, such as physical distancing, may impact modeled hospitalizations. By comparing the outcomes across different intervention scenarios, the CHIME Model tool, the COVID-19Surge tool, and the Capacity Analysis app together become an effective tool for decision- makers. ArcGIS Pro tools and configurable applications together help domain experts research and model the COVID-19 curve. The software also informs policy makers as they try to flatten the curve so that sick people don’t overwhelm the capacity of our health care system.
Analysts can put interactive results into the hands of nontechnical decision-makers using the Capacity Analysis configurable app, designed to work seamlessly with the results of the COVID-19 tools. (Test data—not for policy or decisions.)
GIS Science Response to the COVID-19 Outbreak xxi
