
Page 142 - Mapping the Nation: Taking Climate Action
P. 142
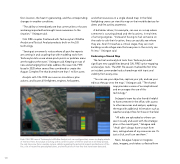
fire's location, the heat it's generating, and the corresponding changes in weather conditions. "The ability to immediately see that communities or houses are being impacted has brought more awareness to the situation," SeLegue said. CAL FIRE couples FireGuard with Technosylva's Wildfire Analyst and Tactical Analyst products built on ArcGIS technology. "Seeing at a moment's notice where all spot fire reports are coming in and coupling that with modeling tools from Technosylva lets us see where pinch points or problem areas are throughout the state," SeLegue said. Keeping on top of new and emerging fires helps address the issue CAL FIRE faced in 2020 when several fires combined to create the August Complex Fire that burned more than 1 million acres. Analysts with CAL FIRE can now run simulations; plan actions; and locate all firefighters, engines, helicopters, and other resources on a single shared map. In the field, firefighting crews can view this map on their mobile devices for alerts and fire activity awareness. A bulldozer driver, for example, can see on a map where someone is scouting ahead and the locations, in real time, of arriving engines. "Instead of having to hail someone on the radio to ask their location, they can quickly see where they are. And if it reaches a critical stage, they can start building a safe refuge area that everyone in the vicinity can fit into," SeLegue said. Embracing a Shared Map The tactical and analytical tools from Technosylva add significant new capabilities beyond CAL FIRE's prior mapping and analysis tools. The 2021 fire season marked the first time an incident commander had a shared map with input and visibility from every crew. "You can see your objective, capture your job, and see your edits as they go onto the map," SeLegue said. "The shared 141 Each CAL FIRE user of Technosylva's Wildfire Analyst tool can configure their screen to display details of interest. Here, the analyst is looking at the current location of the fire and how it will likely spread, the real-time view from a nearby camera, details regarding the potential impacts and behavior of the fire, a list of recent fire spread predictions, and notifications of new fires that have been detected. map provides a sense of accomplishment and encourages the use of this technology." SeLegue's team has also found it helpful to have someone in the office, with access to other resources and analysis, updating the map with additional information such as weather and spot fires for those in the field. "All edits are uploaded so others can see it visually and assist with the strategic plan or the overall goal," SeLegue said. "And I don't always have to start from zero, asking where all my resources are. It's just a click, and I can see them." Next, SeLegue hopes to integrate data, imagery, and videos collected from
