
Page 48 - Mapping the Nation: Taking Climate Action
P. 48
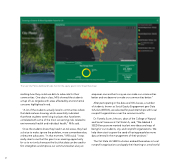
47 The new City Plants dashboard helps monitor the equity goal in LA's Green New Deal. realizing how they could use data to advocate for their communities. One day in class, Mills showed the students a map of Los Angeles with areas affected by environmental concerns highlighted in red. "A lot of the students actually lived in communities where that dark red was showing, which essentially indicated that these students were living in places that have been correlated with some of the most concerning risks related to environmental health and individual health," Mills said. Once the students knew they lived in at-risk areas, they had a choice to make: ignore the problem, move somewhere else, or become advocates. "In that moment," Mills said, "it was really clear to me that this grant is an amazing opportunity for us to not only showcase the fact that data can be used to first strengthen and improve our communities but also just empower one another to say we can make our communities better and we deserve to make our communities better." After participating in the data and GIS classes, a number of students, known as Social Equity Engagement geo-Data Scholars (SEEDS), are selected for paid internships with local nonprofit organizations over the summer months. Dr. Pamela Scott-Johnson, dean of the College of Natural and Social Sciences at Cal State LA, said, "We labeled it SEEDS because we wanted to plant new ideas and ways of being for our students, city, and nonprofit organizations. We help them start to grow the seed of having people be more data oriented in the management of their projects." The Cal State LA SEEDS scholars embed themselves in local nonprofit organizations and apply their learning to a real-world
