
Page 58 - Mapping the Nation: Taking Climate Action
P. 58
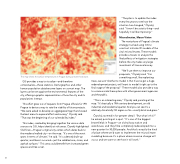
57 This map shows the surface temperatures in Prague during a recent heat wave. GIS provides a way to visualize—and therefore contextualize—these statistics. Demographics and other human population data become layers on a smart map. The layers can be set against the environmental features of the city, offering a graphic representation of how the city and its populations interact. This effort grew out of requests from Prague officials for IPR Prague to devise a way to rate the viability of future projects. "We were asked to develop an aggregated map that showed the best areas to expend effort and money," Čtyroký said. "That was the beginning of our vulnerability index." This index, created by bringing together the various data sources via GIS, helps identify at-risk areas. Čtyroký highlighted Old Town—Prague's original city center, which dates back to the medieval walled city—on the map. "It's one of the worst spots in terms of climate," he said. "It's a densely built-up quarter, and there's no wind—just the cobblestone, stone, and asphalt surfaces." This area could benefit from increased green spaces and tree cover. "The plan is to update the index every few years to see how the situation has changed," Čtyroký said. "It won't be a static thing—and hopefully it will be improving." Microclimates, Macro Vision The next phase of Prague’s climate strategy involved using GIS to construct intricate 3D models of the city’s microclimates. These models provide a means to analyze the likely effects of mitigation strategies before the city makes any large investment of time and money. "We'll use them to improve our proposals," Čtyroký said. "For something small, like replanting trees, we won't bother to model it. But if we've got a huge redevelopment project, we'll want to model it right up to the final stage of the proposal." These models also provide a way to communicate these plans with other government agencies and the public. "This is an interesting area," Čtyroký said, pointing at the map. "It's basically a 19th-century development, an old industrial and residential quarter. And you can see it's a relatively climatically OK region so far—mostly brick and grass." Čtyroký zoomed in for greater detail. "But what's this?" he asked, pointing at a spot. "It's one of the biggest brownfields in Prague—an old railway station and warehouse, and they'll be completely redeveloped into a new quarter for 30,000 people. And that's exactly the kind of place where we'd want to implement the microclimate modeling because it's a place where massive change will occur, and we want to see how it will work."
