| Using ArcXML Renderers |
|
| Symbols that can be used inside of SIMPLELABELRENDERER and VALUEMAPLABELRENDERER are: |
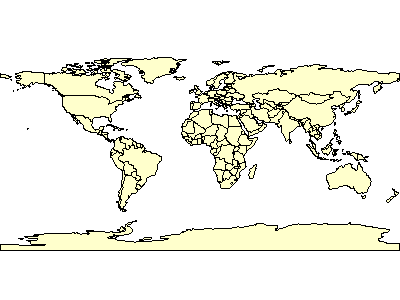
| Using SIMPLERENDERER: |
|
<?xml version="1.0" encoding="UTF-8"?> <ARCXML version="1.1"> <CONFIG> <ENVIRONMENT> <LOCALE country="US" language="en" variant="" /> <UIFONT color="0,0,0" name="Arial" size="12" style="regular" /> </ENVIRONMENT> <MAP> <PROPERTIES> <ENVELOPE minx="-180" miny="-90" maxx="180" maxy="90" name="Initial_Extent" /> <MAPUNITS units="decimal_degrees" /> </PROPERTIES> <WORKSPACES> <SHAPEWORKSPACE name="shp_ws-0" directory="C:\ESRIDATA\WORLD" /> </WORKSPACES> <LAYER type="featureclass" name="CNTRY94" visible="true" id="1"> <DATASET name="CNTRY94" type="polygon" workspace="shp_ws-0" /> <SIMPLERENDERER> <SIMPLEPOLYGONSYMBOL fillcolor="255,255,204" filltype="solid" /> </SIMPLERENDERER> </LAYER> </MAP> </CONFIG> </ARCXML> |

|
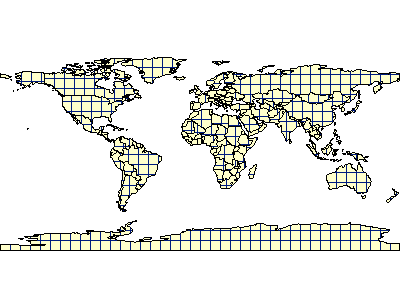
| Using SIMPLERENDERERs inside a GROUPRENDERER: |
|
<?xml version="1.0" encoding="UTF-8"?> <ARCXML version="1.1"> <CONFIG> <ENVIRONMENT> <LOCALE country="US" language="en" variant="" /> <UIFONT color="0,0,0" name="Arial" size="12" style="regular" /> </ENVIRONMENT> <MAP> <PROPERTIES> <ENVELOPE minx="-180" miny="-90" maxx="180" maxy="90" name="Initial_Extent" /> <MAPUNITS units="decimal_degrees" /> </PROPERTIES> <WORKSPACES> <SHAPEWORKSPACE name="shp_ws-0" directory="C:\ESRIDATA\WORLD" /> </WORKSPACES> <LAYER type="featureclass" name="CNTRY94" visible="true" id="1"> <DATASET name="CNTRY94" type="polygon" workspace="shp_ws-0" /> <GROUPRENDERER> <SIMPLERENDERER> <SIMPLEPOLYGONSYMBOL fillcolor="255,255,204" filltype="solid" /> </SIMPLERENDERER> <SIMPLERENDERER> <SIMPLEPOLYGONSYMBOL fillcolor="0,27,127" filltype="cross" /> </SIMPLERENDERER> </GROUPRENDERER> </LAYER> </MAP> </CONFIG> </ARCXML> |
|
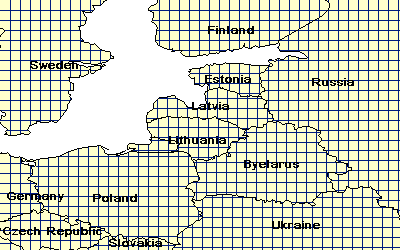
| Using SIMPLERENDERER and SIMPLELABELRENDERER: |
|
<?xml version="1.0" encoding="UTF-8"?> <ARCXML version="1.1"> <CONFIG> <ENVIRONMENT> <LOCALE country="US" language="en" variant="" /> <UIFONT color="0,0,0" name="Arial" size="12" style="regular" /> </ENVIRONMENT> <MAP> <PROPERTIES> <ENVELOPE minx="-180" miny="-90" maxx="180" maxy="90" name="Initial_Extent" /> <MAPUNITS units="decimal_degrees" /> </PROPERTIES> <WORKSPACES> <SHAPEWORKSPACE name="shp_ws-0" directory="C:\ESRIDATA\WORLD" /> </WORKSPACES> <LAYER type="featureclass" name="CNTRY94" visible="true" id="1"> <DATASET name="CNTRY94" type="polygon" workspace="shp_ws-0" /> <GROUPRENDERER> <SIMPLERENDERER> <SIMPLEPOLYGONSYMBOL fillcolor="255,255,204" filltype="solid" /> </SIMPLERENDERER> <SIMPLERENDERER> <SIMPLEPOLYGONSYMBOL fillcolor="0,27,127" filltype="cross" /> </SIMPLERENDERER> <SIMPLELABELRENDERER field="NAME"> <TEXTSYMBOL fontstyle="bold" fontsize="12" /> </SIMPLELABELRENDERER> </GROUPRENDERER> </LAYER> </MAP> </CONFIG> </ARCXML> |
|
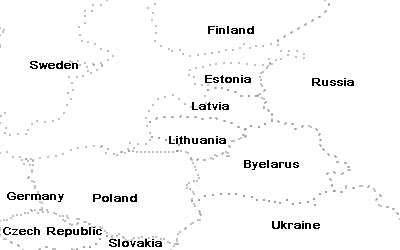
| Using only SIMPLELABELRENDERER: |
|
<?xml version="1.0" encoding="UTF-8"?> <ARCXML version="1.1"> <CONFIG> <ENVIRONMENT> <LOCALE country="US" language="en" variant="" /> <UIFONT color="0,0,0" name="Arial" size="12" style="regular" /> </ENVIRONMENT> <MAP> <PROPERTIES> <ENVELOPE minx="-180" miny="-90" maxx="180" maxy="90" name="Initial_Extent" /> <MAPUNITS units="decimal_degrees" /> </PROPERTIES> <WORKSPACES> <SHAPEWORKSPACE name="shp_ws-0" directory="C:\ESRIDATA\WORLD" /> </WORKSPACES> <LAYER type="featureclass" name="CNTRY94" visible="true" id="1"> <DATASET name="CNTRY94" type="polygon" workspace="shp_ws-0" /> <SIMPLELABELRENDERER field="NAME"> <TEXTSYMBOL fontstyle="bold" fontsize="12" /> </SIMPLELABELRENDERER> </LAYER> </MAP> </CONFIG> </ARCXML> |
|
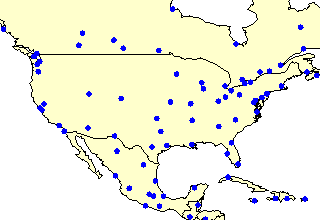
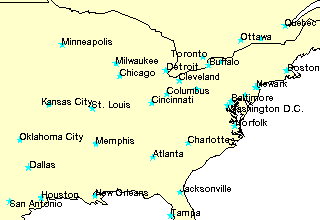
| Using SCALEDEPENDENTRENDERER: |
|
<?xml version="1.0" encoding="UTF-8"?> <ARCXML version="1.1"> <CONFIG> <ENVIRONMENT> <LOCALE country="US" language="en" variant="" /> <UIFONT color="0,0,0" name="Arial" size="12" style="regular" /> </ENVIRONMENT> <MAP> <PROPERTIES> <ENVELOPE minx="-180" miny="-90" maxx="180" maxy="90" name="Initial_Extent" /> <MAPUNITS units="decimal_degrees" /> </PROPERTIES> <WORKSPACES> <SHAPEWORKSPACE name="shp_ws-0" directory="C:\ESRIDATA\WORLD" /> </WORKSPACES> <LAYER type="featureclass" name="CNTRY94" visible="true" id="1"> <DATASET name="CNTRY94" type="polygon" workspace="shp_ws-0" /> <SIMPLERENDERER> <SIMPLEPOLYGONSYMBOL fillcolor="255,255,204" filltype="solid" /> </SIMPLERENDERER> </LAYER> <LAYER type="featureclass" name="Cities" visible="true" id="2" maxscale="1:50000000"> <DATASET name="CITIES" type="point" workspace="shp_ws-0" /> <GROUPRENDERER> <SCALEDEPENDENTRENDERER lower="1:25000000" upper="1:50000000"> <SIMPLERENDERER> <SIMPLEMARKERSYMBOL color="0,0,255" width="8" type="circle" /> </SIMPLERENDERER> </SCALEDEPENDENTRENDERER> <SCALEDEPENDENTRENDERER upper="1:25000000"> <SIMPLERENDERER> <SIMPLEMARKERSYMBOL color="0,255,255" width="16" type="star" /> </SIMPLERENDERER> </SCALEDEPENDENTRENDERER> <SCALEDEPENDENTRENDERER upper="1:25000000"> <SIMPLELABELRENDERER field="NAME"> <TEXTSYMBOL fontstyle="regular" fontsize="10" /> </SIMPLELABELRENDERER> </SCALEDEPENDENTRENDERER> </GROUPRENDERER> </LAYER> </MAP> </CONFIG> </ARCXML> |
|
|
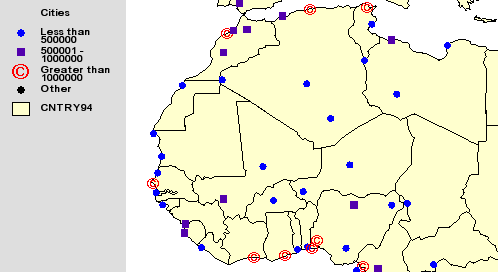
| Using VALUEMAPRENDERER: |
|
<?xml version="1.0" encoding="UTF-8"?> <ARCXML version="1.1"> <CONFIG> <ENVIRONMENT> <LOCALE country="US" language="en" variant="" /> <UIFONT color="0,0,0" name="Arial" size="12" style="regular" /> </ENVIRONMENT> <MAP> <PROPERTIES> <ENVELOPE minx="-180" miny="-90" maxx="180" maxy="90" name="Initial_Extent" /> <MAPUNITS units="decimal_degrees" /> </PROPERTIES> <WORKSPACES> <SHAPEWORKSPACE name="shp_ws-6" directory="C:\ESRIDATA\WORLD" /> </WORKSPACES> <LAYER type="featureclass" name="CNTRY94" visible="true" id="0"> <DATASET name="CNTRY94" type="polygon" workspace="shp_ws-6" /> <SIMPLERENDERER> <SIMPLEPOLYGONSYMBOL fillcolor="255,255,204" filltype="solid" /> </SIMPLERENDERER> </LAYER> <LAYER type="featureclass" name="Cities" visible="true" id="1" maxscale="1:50000000"> <DATASET name="CITIES" type="point" workspace="shp_ws-6" /> <VALUEMAPRENDERER lookupfield="POPULATION"> <RANGE lower="0" upper="500000" label="Less than 500000"> <SIMPLEMARKERSYMBOL color="0,0,255" width="8" type="circle" /> </RANGE> <RANGE lower="500001" upper="1000000" label="500001 - 1000000"> <SIMPLEMARKERSYMBOL color="85,0,170" width="8" type="square" /> </RANGE> <RANGE lower="1000001" upper="23620001" label="Greater than 1000000"> <TRUETYPEMARKERSYMBOL fontstyle="regular" character="169" font="Arial" fontcolor="255,0,0" fontsize="20" /> </RANGE> <OTHER> <SIMPLEMARKERSYMBOL width="8" /> </OTHER> </VALUEMAPRENDERER> </LAYER> </MAP> </CONFIG> </ARCXML> |
|
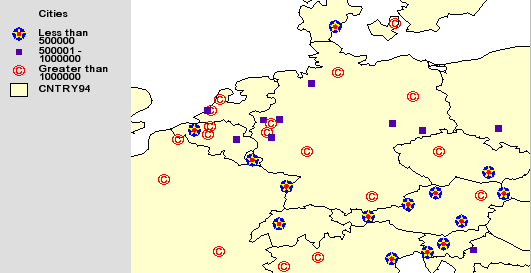
| Using VALUEMAPRENDERER to create a multipart symbol: |
|
<?xml version="1.0" encoding="UTF-8"?> <ARCXML version="1.1"> <CONFIG> <ENVIRONMENT> <LOCALE country="US" language="en" variant="" /> <UIFONT color="0,0,0" name="Arial" size="12" style="regular" /> </ENVIRONMENT> <MAP> <PROPERTIES> <ENVELOPE minx="-180" miny="-90" maxx="180" maxy="90" name="Initial_Extent" /> <MAPUNITS units="decimal_degrees" /> </PROPERTIES> <WORKSPACES> <SHAPEWORKSPACE name="shp_ws-6" directory="C:\ESRIDATA\WORLD" /> </WORKSPACES> <LAYER type="featureclass" name="CNTRY94" visible="true" id="0"> <DATASET name="CNTRY94" type="polygon" workspace="shp_ws-6" /> <SIMPLERENDERER> <SIMPLEPOLYGONSYMBOL fillcolor="255,255,204" filltype="solid" /> </SIMPLERENDERER> </LAYER> <LAYER type="featureclass" name="Cities" visible="true" id="1" maxscale="1:50000000"> <DATASET name="CITIES" type="point" workspace="shp_ws-6" /> <GROUPRENDERER> <VALUEMAPRENDERER lookupfield="POPULATION"> <RANGE lower="0" upper="500000" label="Less than 500000"> <!--blue circle--> <SIMPLEMARKERSYMBOL color="0,0,255" width="16" type="circle" /> </RANGE> <RANGE lower="500001" upper="1000000" label="500001 - 1000000"> <SIMPLEMARKERSYMBOL color="85,0,170" width="7" type="square" /> </RANGE> <RANGE lower="1000001" upper="23620001" label="Greater than 1000000"> <TRUETYPEMARKERSYMBOL fontstyle="regular" character="169" font="Arial" fontcolor="255,0,0" fontsize="20" /> </RANGE> </VALUEMAPRENDERER> <VALUEMAPRENDERER lookupfield="POPULATION"> <RANGE lower="0" upper="500000" label="Less than 500000"> <!--yellow star--> <SIMPLEMARKERSYMBOL color="255,255,0" width="16" type="star" /> </RANGE> </VALUEMAPRENDERER> <VALUEMAPRENDERER lookupfield="POPULATION"> <RANGE lower="0" upper="500000" label="Less than 500000"> <!--red circle--> <SIMPLEMARKERSYMBOL color="255,0,0" width="4" type="circle" /> </RANGE> </VALUEMAPRENDERER> </GROUPRENDERER> </LAYER> </MAP> </CONFIG> </ARCXML> |
|
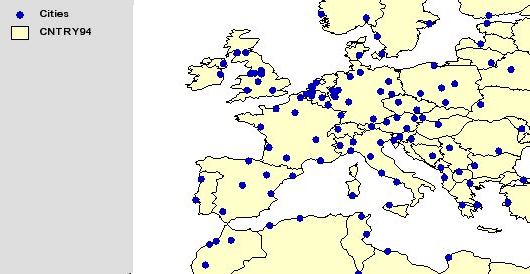
| Using VALUEMAPRENDERER inside a SCALEDEPENDENTRENDERER: |
|
<?xml version="1.0" encoding="UTF-8"?> <ARCXML version="1.1"> <CONFIG> <ENVIRONMENT> <LOCALE country="US" language="en" variant="" /> <UIFONT color="0,0,0" name="Arial" size="12" style="regular" /> </ENVIRONMENT> <MAP> <PROPERTIES> <ENVELOPE minx="-180" miny="-90" maxx="180" maxy="90" name="Initial_Extent" /> <MAPUNITS units="decimal_degrees" /> </PROPERTIES> <WORKSPACES> <SHAPEWORKSPACE name="shp_ws-6" directory="C:\ESRIDATA\WORLD" /> </WORKSPACES> <LAYER type="featureclass" name="CNTRY94" visible="true" id="0"> <DATASET name="CNTRY94" type="polygon" workspace="shp_ws-6" /> <SIMPLERENDERER> <SIMPLEPOLYGONSYMBOL fillcolor="255,255,204" filltype="solid" /> </SIMPLERENDERER> </LAYER> <LAYER type="featureclass" name="Cities" visible="true" id="1" maxscale="1:50000000"> <DATASET name="CITIES" type="point" workspace="shp_ws-6" /> <GROUPRENDERER> <SCALEDEPENDENTRENDERER lower="1:25000000" > <SIMPLERENDERER> <SIMPLEMARKERSYMBOL color="0,0,190" width="8" type="circle" /> </SIMPLERENDERER> </SCALEDEPENDENTRENDERER> <SCALEDEPENDENTRENDERER upper="1:25000000" > <GROUPRENDERER> <VALUEMAPRENDERER lookupfield="POPULATION"> <RANGE lower="0" upper="500000" label="Less than 500000"> <SIMPLEMARKERSYMBOL color="0,0,255" width="16" type="circle" /> </RANGE> <RANGE lower="500001" upper="1000000" label="500001 - 1000000"> <SIMPLEMARKERSYMBOL color="85,0,170" width="7" type="square" /> </RANGE> <RANGE lower="1000001" upper="23620001" label="Greater than 1000000"> <TRUETYPEMARKERSYMBOL fontstyle="regular" character="169" font="Arial" fontcolor="255,0,0" fontsize="20" /> </RANGE> </VALUEMAPRENDERER> <VALUEMAPRENDERER lookupfield="POPULATION"> <RANGE lower="0" upper="500000" label="Less than 500000"> <SIMPLEMARKERSYMBOL color="255,255,0" width="16" type="star" /> </RANGE> </VALUEMAPRENDERER> <VALUEMAPRENDERER lookupfield="POPULATION"> <RANGE lower="0" upper="500000" label="Less than 500000"> <SIMPLEMARKERSYMBOL color="255,0,0" width="4" type="circle" /> </RANGE> </VALUEMAPRENDERER> </GROUPRENDERER> </SCALEDEPENDENTRENDERER> </GROUPRENDERER> </LAYER> </MAP> </CONFIG> </ARCXML> |
|

|
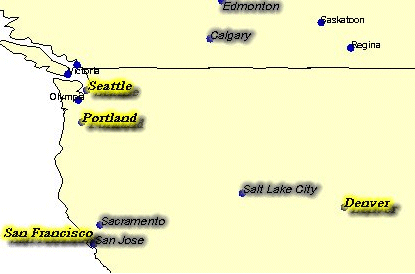
| Using VALUEMAPLABELRENDERER: |
|
<?xml version="1.0" encoding="UTF-8"?> <ARCXML version="1.1"> <CONFIG> <ENVIRONMENT> <LOCALE country="US" language="en" variant="" /> <UIFONT color="0,0,0" name="Arial" size="12" style="regular" /> </ENVIRONMENT> <MAP> <PROPERTIES> <ENVELOPE minx="-180" miny="-90" maxx="180" maxy="90" name="Initial_Extent" /> <MAPUNITS units="decimal_degrees" /> </PROPERTIES> <WORKSPACES> <SHAPEWORKSPACE name="shp_ws-6" directory="C:\ESRIDATA\WORLD" /> </WORKSPACES> <LAYER type="featureclass" name="CNTRY94" visible="true" id="0"> <DATASET name="CNTRY94" type="polygon" workspace="shp_ws-6" /> <SIMPLERENDERER> <SIMPLEPOLYGONSYMBOL fillcolor="255,255,204" filltype="solid" /> </SIMPLERENDERER> </LAYER> <LAYER type="featureclass" name="Cities" visible="true" id="1" maxscale="1:50000000"> <DATASET name="CITIES" type="point" workspace="shp_ws-6" /> <GROUPRENDERER> <SIMPLERENDERER> <SIMPLEMARKERSYMBOL color="0,0,190" width="8" type="circle" /> </SIMPLERENDERER> <VALUEMAPLABELRENDERER lookupfield="POPULATION" labelfield="NAME" > <RANGE lower="0" upper="500000" > <TEXTSYMBOL font="Tahoma" fontstyle="regular" fontsize="10" /> </RANGE> <RANGE lower="500001" upper="1000000" > <TEXTSYMBOL font="Arial" fontstyle="italic" fontsize="12" glowing="125,125,125" /> </RANGE> <RANGE lower="1000001" upper="23620001" > <TEXTSYMBOL font="Times New Roman" fontstyle="bolditalic" fontsize="14" glowing="255,255,0" shadow="0,0,0" /> </RANGE> </VALUEMAPLABELRENDERER> </GROUPRENDERER> </LAYER> </MAP> </CONFIG> </ARCXML> |
|
| City Population Range | Symbol | Label |
| Less than 500,000 | Circle | Tahoma font |
| 500,000 to 1,000,000 | Square | Italic Arial font with glow |
| Greater than 1,000,000 | TrueType symbol | Bold italic Times New Roman font with Glow and Shadow |
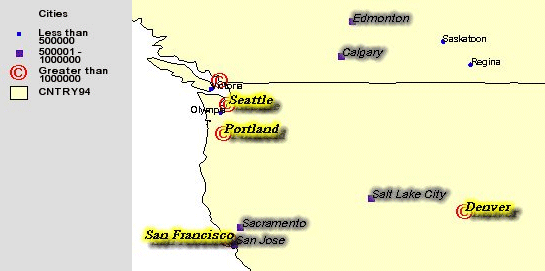
| Using VALUEMAPRENDERER and VALUEMAPLABELRENDERER together: |
|
<?xml version="1.0" encoding="UTF-8"?> <ARCXML version="1.1"> <CONFIG> <ENVIRONMENT> <LOCALE country="US" language="en" variant="" /> <UIFONT color="0,0,0" name="Arial" size="12" style="regular" /> </ENVIRONMENT> <MAP> <PROPERTIES> <ENVELOPE minx="-180" miny="-90" maxx="180" maxy="90" name="Initial_Extent" /> <MAPUNITS units="decimal_degrees" /> </PROPERTIES> <WORKSPACES> <SHAPEWORKSPACE name="shp_ws-6" directory="C:\ESRIDATA\WORLD" /> </WORKSPACES> <LAYER type="featureclass" name="CNTRY94" visible="true" id="0"> <DATASET name="CNTRY94" type="polygon" workspace="shp_ws-6" /> <SIMPLERENDERER> <SIMPLEPOLYGONSYMBOL filltransparency="1.0" fillcolor="255,255,204" /> </SIMPLERENDERER> </LAYER> <LAYER type="featureclass" name="Cities" visible="true" id="1" maxscale="1:50000000"> <DATASET name="CITIES" type="point" workspace="shp_ws-6" /> <GROUPRENDERER> <VALUEMAPRENDERER lookupfield="POPULATION"> <RANGE lower="0" upper="500000" label="Less than 500000"> <SIMPLEMARKERSYMBOL color="0,0,255" width="5" type="circle" /> </RANGE> <RANGE lower="500001" upper="1000000" label="500001 - 1000000"> <SIMPLEMARKERSYMBOL color="85,0,170" width="7" type="square" /> </RANGE> <RANGE lower="1000001" upper="23620001" label="Greater than 1000000"> <TRUETYPEMARKERSYMBOL fontstyle="regular" character="169" font="Arial" fontcolor="255,0,0" fontsize="20" /> </RANGE> </VALUEMAPRENDERER> <VALUEMAPLABELRENDERER lookupfield="POPULATION" labelfield="NAME" > <RANGE lower="0" upper="500000" > <TEXTSYMBOL font="Tahoma" fontstyle="regular" fontsize="10" /> </RANGE> <RANGE lower="500001" upper="1000000" > <TEXTSYMBOL font="Arial" fontstyle="italic" fontsize="12" glowing="125,125,125" /> </RANGE> <RANGE lower="1000001" upper="23620001" > <TEXTSYMBOL font="Times New Roman" fontstyle="bolditalic" fontsize="14" glowing="255,255,0" shadow="0,0,0" /> </RANGE> </VALUEMAPLABELRENDERER> </GROUPRENDERER> </LAYER> </MAP> </CONFIG> </ARCXML> |
|
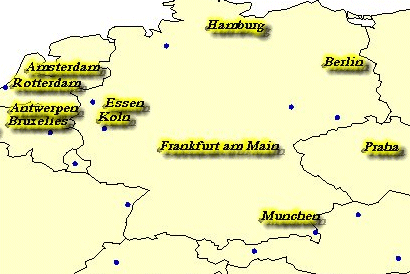
| Using VALUEMAPLABELRENDERER to label a subgroup of features: |
|
<?xml version="1.0" encoding="UTF-8"?> <ARCXML version="1.1"> <CONFIG> <ENVIRONMENT> <LOCALE country="US" language="en" variant="" /> <UIFONT color="0,0,0" name="Arial" size="12" style="regular" /> </ENVIRONMENT> <MAP> <PROPERTIES> <ENVELOPE minx="-180" miny="-90" maxx="180" maxy="90" name="Initial_Extent" /> <MAPUNITS units="decimal_degrees" /> </PROPERTIES> <WORKSPACES> <SHAPEWORKSPACE name="shp_ws-6" directory="C:\ESRIDATA\WORLD" /> </WORKSPACES> <LAYER type="featureclass" name="CNTRY94" visible="true" id="0"> <DATASET name="CNTRY94" type="polygon" workspace="shp_ws-6" /> <SIMPLERENDERER> <SIMPLEPOLYGONSYMBOL fillcolor="255,255,204" filltype="solid" /> </SIMPLERENDERER> </LAYER> <LAYER type="featureclass" name="Cities" visible="true" id="1" maxscale="1:50000000"> <DATASET name="CITIES" type="point" workspace="shp_ws-6" /> <GROUPRENDERER> <SIMPLERENDERER> <SIMPLEMARKERSYMBOL color="0,0,190" width="6" type="circle" /> </SIMPLERENDERER> <VALUEMAPLABELRENDERER lookupfield="POPULATION" labelfield="NAME" > <RANGE lower="1000000" upper="23620001" > <TEXTSYMBOL font="Times New Roman" fontstyle="bolditalic" fontsize="14" glowing="255,255,0" shadow="0,0,0" /> </RANGE> </VALUEMAPLABELRENDERER> </GROUPRENDERER> </LAYER> </MAP> </CONFIG> </ARCXML> |
|
| City Population Range | Label | |
| When scale is greater than 1:25000000: | ||
| Greater than 1,000,000 | Bold italic Times New Roman font with Glow and Shadow | |
| When scale is less than 1:25000000: | ||
| Less than 500,000 | Tahoma font | |
| 500,000 to 1,000,000 | Italic Arial font with glow | |
| Greater than 1,000,000 | Bold italic Times New Roman font with Glow and Shadow | |
| Using VALUEMAPLABELRENDERER inside a SCALEDEPENDENTRENDERER: |
|
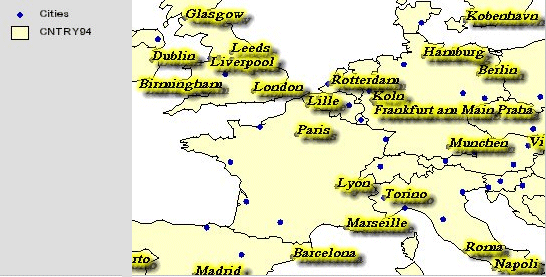
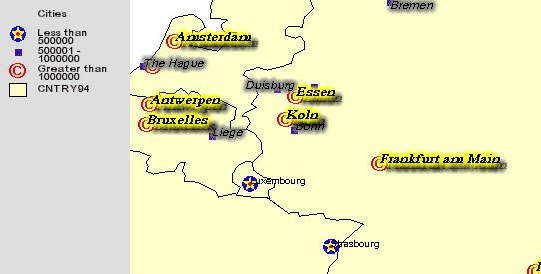
<?xml version="1.0" encoding="UTF-8"?> <ARCXML version="1.1"> <CONFIG> <ENVIRONMENT> <LOCALE country="US" language="en" variant="" /> <UIFONT color="0,0,0" name="Arial" size="12" style="regular" /> </ENVIRONMENT> <MAP> <PROPERTIES> <ENVELOPE minx="-180" miny="-90" maxx="180" maxy="90" name="Initial_Extent" /> <MAPUNITS units="decimal_degrees" /> </PROPERTIES> <WORKSPACES> <SHAPEWORKSPACE name="shp_ws-6" directory="C:\ESRIDATA\WORLD" /> </WORKSPACES> <LAYER type="featureclass" name="CNTRY94" visible="true" id="0"> <DATASET name="CNTRY94" type="polygon" workspace="shp_ws-6" /> <SIMPLERENDERER> <SIMPLEPOLYGONSYMBOL fillcolor="255,255,204" filltype="solid" /> </SIMPLERENDERER> </LAYER> <LAYER type="featureclass" name="Cities" visible="true" id="1" maxscale="1:50000000"> <DATASET name="CITIES" type="point" workspace="shp_ws-6" /> <GROUPRENDERER> <!--Around all renderers--> <SCALEDEPENDENTRENDERER lower="1:25000000" > <!--labeling and rendering when the scale is greater than 1:25000000--> <GROUPRENDERER> <SIMPLERENDERER> <SIMPLEMARKERSYMBOL color="0,0,190" width="6" type="circle" /> </SIMPLERENDERER> <!--Only label cities with population greater than 1,000,000--> <VALUEMAPLABELRENDERER lookupfield="POPULATION" labelfield="NAME" > <RANGE lower="1000001" upper="23620001" > <TEXTSYMBOL font="Times New Roman" fontstyle="bold" fontsize="14" glowing="255,255,0" shadow="0,0,0" /> </RANGE> </VALUEMAPLABELRENDERER> </GROUPRENDERER> </SCALEDEPENDENTRENDERER> <SCALEDEPENDENTRENDERER upper="1:25000000" ><!--Labeling and rendering when the scale is less than 1:25000000--> <GROUPRENDERER> <!--Render cities based on population--> <VALUEMAPRENDERER lookupfield="POPULATION"> <RANGE lower="0" upper="500000" label="Less than 500000"> <SIMPLEMARKERSYMBOL color="0,0,255" width="16" type="circle" /> </RANGE> <RANGE lower="500001" upper="1000000" label="500001 - 1000000"> <SIMPLEMARKERSYMBOL color="85,0,170" width="7" type="square" /> </RANGE> <RANGE lower="1000001" upper="23620001" label="Greater than 1000000"> <TRUETYPEMARKERSYMBOL fontstyle="regular" character="169" font="Arial" fontcolor="255,0,0" fontsize="20" /> </RANGE> </VALUEMAPRENDERER> <VALUEMAPRENDERER lookupfield="POPULATION"> <RANGE lower="0" upper="500000" label="Less than 500000"> <SIMPLEMARKERSYMBOL color="255,255,0" width="16" type="star" /> </RANGE> </VALUEMAPRENDERER> <VALUEMAPRENDERER lookupfield="POPULATION"> <RANGE lower="0" upper="500000" label="Less than 500000"> <SIMPLEMARKERSYMBOL color="255,0,0" width="4" type="circle" /> </RANGE> </VALUEMAPRENDERER> <!--Label all cities based on population--> <VALUEMAPLABELRENDERER lookupfield="POPULATION" labelfield="NAME" > <RANGE lower="0" upper="500000" > <TEXTSYMBOL font="Tahoma" fontstyle="regular" fontsize="10" /> </RANGE> <RANGE lower="500001" upper="1000000" > <TEXTSYMBOL font="Arial" fontstyle="italic" fontsize="12" glowing="125,125,125" /> </RANGE> <RANGE lower="1000001" upper="23620001" > <TEXTSYMBOL font="Times New Roman" fontstyle="bolditalic" fontsize="14" glowing="255,255,0" shadow="0,0,0" /> </RANGE> </VALUEMAPLABELRENDERER> </GROUPRENDERER> </SCALEDEPENDENTRENDERER> </GROUPRENDERER> </LAYER> </MAP> </CONFIG> </ARCXML> |
|
|
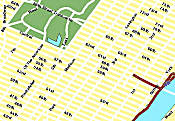
| Entire map configuration file: |
|
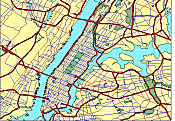
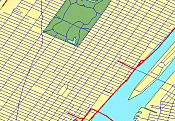
<?xml version="1.0" encoding="UTF-8"?> <ARCXML version="1.1"> <CONFIG> <ENVIRONMENT> <LOCALE country="US" language="en" variant="" /> <UIFONT color="0,0,0" name="Arial" size="12" style="regular" /> </ENVIRONMENT> <MAP> <PROPERTIES> <ENVELOPE minx="-74.066" miny="40.689" maxx="-73.823" maxy="40.883" name="Initial_Extent" /> <MAPUNITS units="decimal_degrees" /> </PROPERTIES> <WORKSPACES> <SHAPEWORKSPACE name="shp_ws-0" directory="c:\nycity\data" /> </WORKSPACES> <LAYER type="featureclass" name="Background" visible="true" id="0" > <DATASET name="nyc_back" type="polygon" workspace="shp_ws-0" /> <SIMPLERENDERER> <SIMPLEPOLYGONSYMBOL fillcolor="145,239,254" filltype="solid" /> </SIMPLERENDERER> </LAYER> <LAYER type="featureclass" name="City Limits" visible="true" id="1" > <DATASET name="nyc_bound" type="polygon" workspace="shp_ws-0" /> <SIMPLERENDERER> <SIMPLEPOLYGONSYMBOL fillcolor="255,249,165" filltype="solid" /> </SIMPLERENDERER> </LAYER> <LAYER type="featureclass" name="Parks" visible="true" id="2" > <DATASET name="nyc_parks" type="polygon" workspace="shp_ws-0" /> <SIMPLERENDERER> <SIMPLEPOLYGONSYMBOL fillcolor="135,184,114" filltype="solid" /> </SIMPLERENDERER> </LAYER> <LAYER type="featureclass" name="Water" visible="true" id="3" > <DATASET name="nyc_water" type="polygon" workspace="shp_ws-0" /> <SIMPLERENDERER> <SIMPLEPOLYGONSYMBOL fillcolor="145,239,254" filltype="solid" /> </SIMPLERENDERER> </LAYER> <LAYER type="featureclass" name="Roads" visible="true" id="4" maxscale="1:35000"> <DATASET name="nyc_roads" type="line" workspace="shp_ws-0" /> <GROUPRENDERER> <SCALEDEPENDENTRENDERER lower="1:21300" > <VALUEMAPRENDERER lookupfield="ROAD_TYPE"> <EXACT value="Freeway"> <SIMPLELINESYMBOL type="solid" width="3" color="255,0,0" /> </EXACT> <EXACT value="Street"> <SIMPLELINESYMBOL type="solid" width="1" color="0,0,255" /> </EXACT> </VALUEMAPRENDERER> </SCALEDEPENDENTRENDERER> <SCALEDEPENDENTRENDERER upper="1:21300"> <GROUPRENDERER> <VALUEMAPRENDERER lookupfield="ROAD_TYPE"> <EXACT value="Freeway"> <SIMPLELINESYMBOL type="solid" width="9" color="0,0,0" /> </EXACT> <EXACT value="Street"> <SIMPLELINESYMBOL type="solid" width="8" color="255,255,255" /> </EXACT> </VALUEMAPRENDERER> <VALUEMAPRENDERER lookupfield="ROAD_TYPE"> <EXACT value="Freeway"> <SIMPLELINESYMBOL type="solid" width="7" color="255,0,0" /> </EXACT> </VALUEMAPRENDERER> <VALUEMAPRENDERER lookupfield="ROAD_TYPE"> <EXACT value="Freeway"> <SIMPLELINESYMBOL type="solid" width="3" color="0,0,0" /> </EXACT> </VALUEMAPRENDERER> <VALUEMAPRENDERER lookupfield="ROAD_TYPE"> <EXACT value="Freeway"> <SIMPLELINESYMBOL type="solid" width="1" color="255,255,255" /> </EXACT> </VALUEMAPRENDERER> </GROUPRENDERER> </SCALEDEPENDENTRENDERER> <SCALEDEPENDENTRENDERER upper="1:25000"> <VALUEMAPLABELRENDERER lookupfield="ROAD_TYPE" labelfield="NAME" linelabelposition="PlaceOnTop" howmanylabels="One_label_per_name"> <EXACT value="Freeway"> <TEXTSYMBOL font="Arial" fontsize="14" fontstyle="bold" fontcolor="0,0,255" glowing="153,153,153"/> </EXACT> <EXACT value="Street"> <TEXTSYMBOL font="Arial" fontsize="14" fontstyle="bold" fontcolor="0,0,0" /> </EXACT> </VALUEMAPLABELRENDERER> </SCALEDEPENDENTRENDERER> </GROUPRENDERER> </LAYER> <LAYER type="featureclass" name="Roads" visible="true" id="5" minscale="1:35000"> <DATASET name="nyc_mainroads" type="line" workspace="shp_ws-0" /> <GROUPRENDERER> <VALUEMAPRENDERER lookupfield="ROAD_TYPE"> <EXACT value="Freeway"> <SIMPLELINESYMBOL type="solid" width="4" color="0,0,0" /> </EXACT> <EXACT value="Secondary"> <SIMPLELINESYMBOL type="solid" width="1" color="0,0,255" /> </EXACT> <EXACT value="Primary"> <SIMPLELINESYMBOL type="solid" width="1" color="255,0,0" /> </EXACT> </VALUEMAPRENDERER> <VALUEMAPRENDERER lookupfield="ROAD_TYPE"> <EXACT value="Freeway"> <SIMPLELINESYMBOL type="solid" width="2" color="255,0,0" /> </EXACT> </VALUEMAPRENDERER> </GROUPRENDERER> </LAYER> </MAP> </CONFIG> </ARCXML> |
|
|
|
| Layer Alias Name as Seen in Legend | Shapefile Name |
| Background | nyc_back |
| City Limits | nyc_bound |
| Parks | nyc_parks |
| Water | nyc_water |
| Roads | nyc_roads |
| Roads | nyc_mainroads |
| Nyc_back Layer: |
|
<LAYER type="featureclass" name="Background" visible="true" id="0" > <DATASET name="nyc_back" type="polygon" workspace="shp_ws-0" /> <SIMPLERENDERER> <SIMPLEPOLYGONSYMBOL fillcolor="145,239,254" filltype="solid" /> </SIMPLERENDERER> </LAYER> |
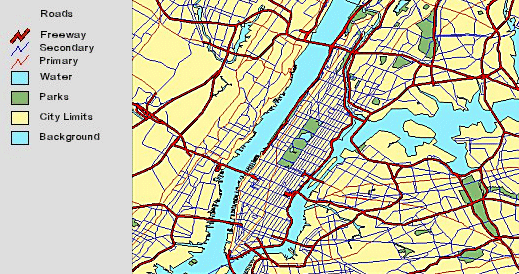
| Road Type | Symbol |
| Freeway | Uses a multipart line symbol of a red line with a width of two pixels on top of a black line with a width of four pixels. |
| Secondary | Uses a blue line symbol with a width of one pixel. |
| Primary | Uses a red line symbol with a width of one pixel. |
| Nyc_mainroads layer: |
|
<LAYER type="featureclass" name="Roads" visible="true" id="5" minscale="1:35000"> <DATASET name="nyc_mainroads" type="line" workspace="shp_ws-0" /> <GROUPRENDERER> <VALUEMAPRENDERER lookupfield="ROAD_TYPE"> <EXACT value="Freeway"> <SIMPLELINESYMBOL type="solid" width="4" color="0,0,0" /> </EXACT> <EXACT value="Secondary"> <SIMPLELINESYMBOL type="solid" width="1" color="0,0,255" /> </EXACT> <EXACT value="Primary"> <SIMPLELINESYMBOL type="solid" width="1" color="255,0,0" /> </EXACT> </VALUEMAPRENDERER> <VALUEMAPRENDERER lookupfield="ROAD_TYPE"> <EXACT value="Freeway"> <SIMPLELINESYMBOL type="solid" width="2" color="255,0,0" /> </EXACT> </VALUEMAPRENDERER> </GROUPRENDERER> </LAYER> |
|
| Using SIMPLERENDERER: |
|
<LAYER type="featureclass" name="Roads" visible="true" id="4" maxscale="1:35000"> <DATASET name="nyc_roads" type="line" workspace="shp_ws-0" /> ... </LAYER> |
| Using SIMPLERENDERER: |
|
<LAYER…> <GROUPRENDERER> <SCALEDEPENDENTRENDERER lower="1:21300"> …less detailed rendering… </SCALEDEPENDENTRENDERER> <SCALEDEPENDENTRENDERER upper="1:21300"> …more detailed rendering… </SCALEDEPENDENTRENDERER> <SCALEDEPENDENTRENDERER upper="1:25000"> …label rendering… </SCALEDEPENDENTRENDERER> </GROUPRENDERER> </LAYER> |
|
|
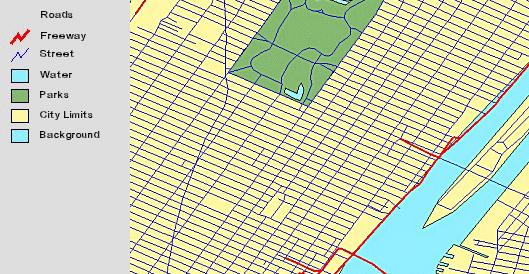
| Using SCALEDEPENDENTRENDERER for nyc_roads when the scale is greater than 1:21000: |
|
<SCALEDEPENDENTRENDERER lower="1:21300" > <VALUEMAPRENDERER lookupfield="ROAD_TYPE"> <EXACT value="Freeway"> <SIMPLELINESYMBOL type="solid" width="3" color="255,0,0" /> </EXACT> <EXACT value="Street"> <SIMPLELINESYMBOL type="solid" width="1" color="0,0,255" /> </EXACT> </VALUEMAPRENDERER> </SCALEDEPENDENTRENDERER> |

|
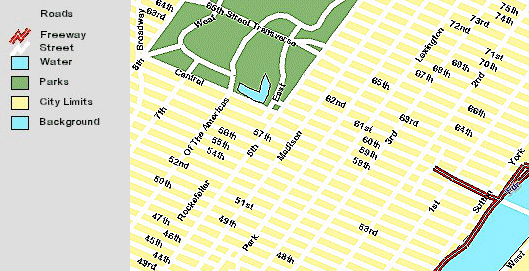
| Using SCALEDEPENDENTRENDERER for nyc_roads when the scale is less than 1:21000: |
|
<SCALEDEPENDENTRENDERER upper="1:21300"> <GROUPRENDERER> <VALUEMAPRENDERER lookupfield="ROAD_TYPE"> <EXACT value="Freeway"> <!--black--> <SIMPLELINESYMBOL type="solid" width="9" color="0,0,0" /> </EXACT> <EXACT value="Street"> <SIMPLELINESYMBOL type="solid" width="8" color="255,255,255" /> </EXACT> </VALUEMAPRENDERER> <VALUEMAPRENDERER lookupfield="ROAD_TYPE"> <EXACT value="Freeway"> <!--red--> <SIMPLELINESYMBOL type="solid" width="7" color="255,0,0" /> </EXACT> </VALUEMAPRENDERER> <VALUEMAPRENDERER lookupfield="ROAD_TYPE"> <EXACT value="Freeway"> <!--black--> <SIMPLELINESYMBOL type="solid" width="3" color="0,0,0" /> </EXACT> </VALUEMAPRENDERER> <VALUEMAPRENDERER lookupfield="ROAD_TYPE"> <EXACT value="Freeway"> <!--white--> <SIMPLELINESYMBOL type="solid" width="1" color="255,255,255" /> </EXACT> </VALUEMAPRENDERER> </GROUPRENDERER> </SCALEDEPENDENTRENDERER> |
| Labeling for nyc_roads: |
|
<SCALEDEPENDENTRENDERER upper="1:25000"> <VALUEMAPLABELRENDERER lookupfield="ROAD_TYPE" labelfield="NAME" linelabelposition="PlaceOnTop" howmanylabels="One_label_per_name"> <EXACT value="Freeway"> <TEXTSYMBOL font="Arial" fontsize="14" fontstyle="bold" fontcolor="0,0,255" glowing="153,153,153"/> </EXACT> <EXACT value="Street"> <TEXTSYMBOL font="Arial" fontsize="14" fontstyle="bold" fontcolor="0,0,0" /> </EXACT> </VALUEMAPLABELRENDERER> </SCALEDEPENDENTRENDERER> |

|