
Page 90 - Mapping the Nation: Taking Climate Action
P. 90
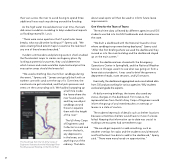
their cars across the river to avoid having to spend three additional hours each way driving around the flooding. As the high water moved downriver over time, the team did some inundation modeling to help understand impacts as flooding neared St. Louis. "There were some questions that if a particular levee breaks, what would we be looking at?" Sperry said. "We were creating flood extent maps to examine the realities if any one of these levees breached." Incident commanders and planning section chiefs studied the flood extent maps to create contingency plans. By looking at potential outcomes, they could determine which homes and roads would be impacted and prioritize evacuation areas should the levees fail. "We used something like one million sandbags during the event," Sperry said. "Levees are typically built with an earthen core with sand over the top of it. Over time, the sand and core get saturated, and that puts pressure and stress on the surrounding soils. We had boils popping up about weak spots will then be used to inform future levee improvements. One View for the Team of Teams The real-time data collected by different agencies and GIS students was fed into ArcGIS Dashboards and shared across the state. "We built a dashboard with the National Guard to show where sandbag troops were being deployed," Sperry said. "After that first briefing where we used the dashboard, they moved us into the main building and the dashboard stayed up on the main screen." Soon the dashboard was shared with the Emergency Operations Center in Springfield, and the National Weather Service in Chicago used it to see what was going on from a levee status standpoint. It was used to brief the governor, department heads, state senators, and US senators. Eventually, the dashboard aggregated and consolidated data from GIS analysts working for various agencies. WIU students worked alongside the experts. At daily morning briefings, the teams discussed any status changes on the dashboard. For instance, the representatives from the US Army Corps of Engineers would inform the group of any levee breaches or overtops or levees in a state of caution. The students kept track of details such as shelter locations because sometimes shelters would have to move if a levee failed. Keeping that information up-to-date was crucial to making sure evacuees had somewhere to go. "We would get requests to add something, such as weather overlays for radar, and the students would research and find the best live data to add to the dashboard," Sperry said. "There were many hands-on opportunities." 89 This flood map from the US Army Corps of Engineers illustrates how the Mississippi River flooding caused flooding on the Illinois River. a half mile inside the levee where the river found a path, and they would put sandbags around those to equalize them with the height of the river." The US Army Corps of Engineers used Collector to mark and monitor the boils, any depressions in the levee, and anything out of the ordinary. That data
