
Page 117 - Mapping the Nation: Taking Climate Action
P. 117
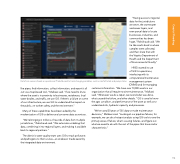
Data from sensors feeds an operational PI dashboard to track changing variables, such as rainfall totals and pump status. "Having access to regional data for the jurisdictions we serve, the stormwater and sewer layers, and even parcel data to locate businesses, industries, and communities has been huge," Robichaud said. "We tie lab results back to where samples were collected, and then share that with the Virginia Department of Health and the Department of Environmental Quality." HRSD started its use of GIS for operations, interfacing with its computerized maintenance management system like pipes, find information, collect information, and report it all out via a map-based tool," Malkawi said. "If we need to know where the asset is in proximity to businesses, residences, local water bodies, and traffic, we use GIS. If there's a failure on some of our infrastructure, we use GIS to understand the impact on the public, on worker safety, and the environment." Many of these capabilities have been aided by the modernization of GIS to deliver and consume data as services. "We're bringing in millions of records of data from multiple jurisdictions," Robichaud said. "We automate scrubbing that data, combining it into regional layers, and making it available back to regional partners." The district's water quality team uses GIS to track pollutants and pathogens to their source—an endeavor made easier by the integrated data environment. (CMMS) and for managing customer information. "We have over 70,000 assets in our organization that all require routine maintenance," Malkawi said. "Whenever we do a repair, we record what was done, what caused the failure, and other details." GIS is used to know the age, condition, and performance of the asset as well as to understand risk, hydraulic capacity, and processes. "We've used 20 years of GIS data to make maintenance decisions," Malkawi said. "Looking at our pipeline failures, for example, we can do a hotspot analysis using GIS tools to see the primary areas of failure, what's causing failures, and figure out what we need to do with the rest of the pipes that have similar characteristics." 116 Coastal Flooding
